
SST update

Warm anomalies have developed in the north over the few weeks due to the break in the monsoon. This heat will fuel the tropical cyclones raging in WA and NT. See TCHP plots here.
Two TCs churning in the shallows
Two category 4 cyclones in the north of the country are leading to mass evacuations and infrastructure shutdowns. The ocean itself will also experience extremes.

currents
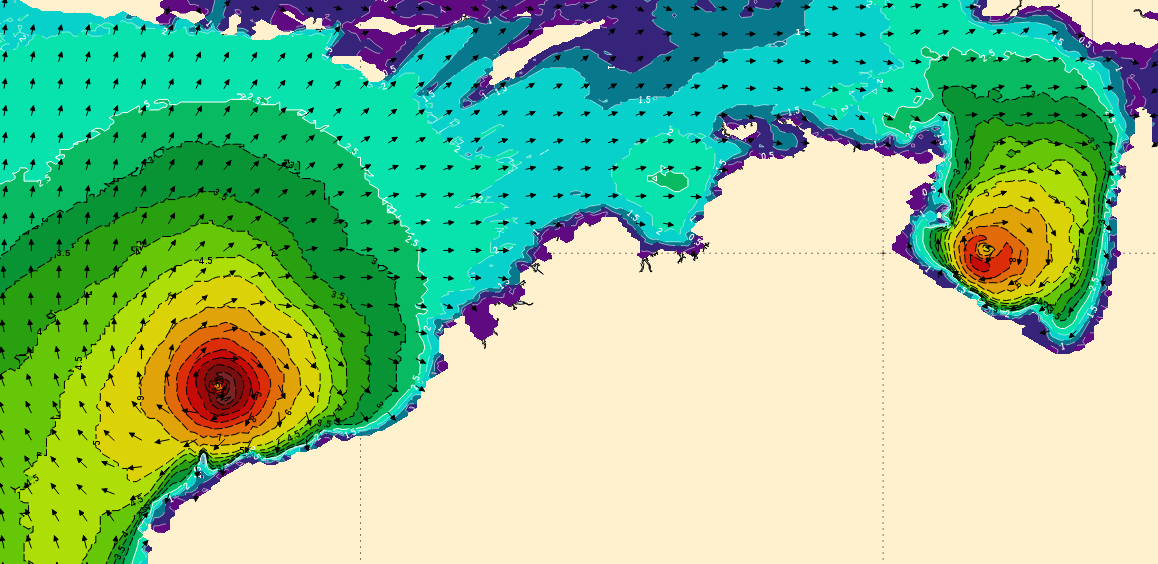
TC Trevor and Severe TC Veronica are stirring up strong winds, waves and currents in their respective shallow water regions, from the surface to the seabed.
In the Gulf of Carpentaria, OceanMAPS images (below) show TC Trevor generating currents of 2 to 3 knots in a large circulation that includes the entire basin. The circulation extends down to depth – see the second image at 34 m depth. Given that OceanMAPS is driven by the relatively coarse global atmospheric model, we would expect current velocities to be even stronger than this in reality.
Meanwhile Severe TC Veronica will stir up similar strength currents on the North West Shelf. In this part of the world, ocean currents at depth can be up to 3 to 5 knots during and post-cyclone. This could damage offshore and underwater structures such as pipelines. The Oil and Gas industry will be on alert, hoping their infrastructure survives this test.


waves
Surface wave heights are also expected to be extreme.
The Auswave-TCX wave model predicts that both systems will cause significant wave heights of 10 to 11 m by tonight (22nd). In the Gulf of Carpentaria the water is only 30 to 50 m deep, so this is huge by comparison. The waves will churn up a lot of sediment, cause coastal erosion in some spots and deposit large amounts of sand in others.
Nott (2006) has described how TCs are the dominant agents in shaping the coastline around the Gulf of Carpentaria. Historical sand sheets can be found to extend several hundred metres inland (deposited by storm tides and waves), and dunes up to 7 m high can be eroded by tropical cyclone events.
Such intensity within a semi-enclosed and shallow area brings to mind the way waves slosh in a bathtub, although with more deadly consequences.
Coastal residents fear the worst and have taken treasured possessions with them to evacuation centres. And hopefully mariners are also staying clear of the area. Two days ago a Gulf fisherman had a narrow escape when he was caught in the strong wind and waves from TC Trevor near the Cape York Penninsula (then only Category 1) and found himself “up to the crotch in crocodiles“.
Further west, waves associated with TC Veronica will continue to build. Models suggest significant wave heights of 13 m on Saturday morning! Remember, individual waves can be up to twice that height.
Already, at the time of writing this article (Friday morning), offshore structures on the North West Shelf are measuring 4.5 to 5 m Hs with peak periods of 12 seconds.
 Auswave-TCX significant wave height forecast for 18 UTC 22nd March – BOM
Storm Surge
The cyclones are also expected to bring large storm surge to the coasts. Results from the TC Storm Surge forecast system at the BOM are shown below. The highest curve shows the top 5th percentile of the ensemble solutions.

TC Trevor could generate surge up to 2.8 m. Combining this with the state of the tide, the combined sea level could be up to 1.4 m above HAT just before the cyclone makes landfall on Saturday morning.

Further west, TC Veronica could generate a surge component up to 2.2 m and the total sea level could reach 2 m above HAT. In a strange and potentially devastating coincidence, TC Veronica’s landfall on Sunday morning coincides with the region’s highest spring tides of the year.
Pilbara Ports Authority has closed its berths and anchorages and sent all ships out to sea. Locals are preparing for the storm: supermarket shelves are already empty and tourists with flimsy caravans are being told to go elsewhere.
The combination of storm surge and very heavy rainfall is conducive to major flooding and severe weather warnings have been issued. The official text reads:

Perhaps local citizens should take the advice of a TC Vance survivor and hide in the bathtub. Twenty years ago the Category 5 system devastated the town of Exmouth and when water was coming through the front door of house a few neighbours jumped into a bathtub together. If the storm surge got to them, then at least it would float.
Dirty water hitting the reef
Cast you minds back to the QLD deluge in February. Have you been wondering where all that freshwater went?
- Some of it has almost reached Lake Eyre. The local yacht club is happily planning a regatta.
- Some of it has poured out to sea and reached the Great Barrier Reef. The coral and fish may not be quite as happy.
Comparing ocean colour images from before and after the event, we can see how the distribution of sediment and chlorophyll has changed. The region is typically very cloudy and it is hard to find clear images for the whole coastline. However, direct eyeballing of images in November compared to March show that Chlorophyll-a has spread seaward and also intensified along the reef itself. This parameter indicates algal blooms.

Similarly, coloured dissolved organic matter (CDOM) has spread from the shore to cover the reef.
Unlike suspended sediments, which tend to settle, CDOM is dissolved in the water and travels into the Great Barrier Reef lagoon as far as the fresh water itself. – BOM

These images imply that the floodwaters have reached the GBR and will be starting to affect the reef.
A recent media article suggested that dirty water from floodwater runoff is hindering reef recovery rates by up to 25%.
The details around this statistic are sketchy; however, it relates to coral recovery rates after disturbances such as bleaching events. However, the team of researchers from Dalhousie University, ARC Centre of Excellence for Coral Reef Studies at James Cook University (Coral CoE), the University of Adelaide and Lancaster University, found that even if we cleaned up the water:
no level of water quality improvement was able to maintain current levels of coral cover among the most scenic and valuable outer-shelf reefs – Phys.org
Slowing down climate change is our best hope for the outer GBR.