
SST

The main change in SSTs this week is over the North West Shelf where temperatures have warmed up a bit and anomalies are back to neutral. However, the region between Shark Bay and the North West Cape remains very cool at 1 to 3 degrees below average.

Marine heat wave update
There are signs that the Tasman Sea MHW is starting to cool, although the anomalies are still at 2 to 3 degrees over a large parts of the Tasman. The peak of this event was in late January but how do things look now?
The images below show the exceedence outside the 95th percentile. At the surface (2.5 m) there are many warm patches, but at depth the exceedence increases. The heat wave anomaly is peaking at 40 to 50 m depth.

The transect tool on the webviewer is handy here. We can see a slice of warm water that is deeper at the western end.
A comparison with the 99th percentile shows the same story. At the surface it doesn’t look too bad, but at 48.5 m depth there are worryingly large anomalies, albeit in clumpy patches.

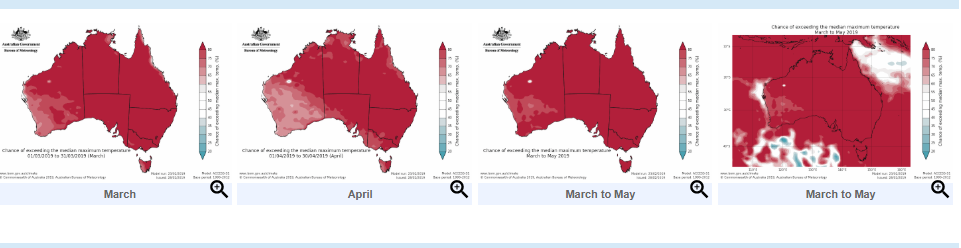
Seasonal outlook and the ocean
The BOM’s climate outlook was released yesterday, with a statement declaring that this summer 2018-2019 was the hottest on record. Now that we are sliding into autumn, absolute temperatures should cool but ‘hotter than average’ conditions may continue for a while yet.
The autumnal outlook is based on the ACCESS-S1 system. The ocean component uses the UK’s NEMO model, initialised using FOAM. The ocean model has 75 vertical levels and is fully coupled to the atmosphere every three hours. For full details, see the description here.
The ACCESS-S ouput shows that most of the country is highly likely to be warmer than average. However, there is less chance of high temperatures in the Coral Sea, off western WA, and to the south of the Bight in the Southern Ocean.

Notice how the cooler areas over the ocean for a three-month fully coupled system show uncanny similarities to the areas of negative SST anomalies just last week.

Perhaps the similarities are not surprising. In a well-mixed neutral atmosphere over a long enough fetch, the air temperature at 2 m should be very similar to the ocean temperature. The feedback loop between atmosphere and ocean, combined with the large heat capacity of the ocean, leads to longevity in SST patterns.
Let’s look at the SST anomaly autumn forecasts themselves. It shows a weakening of most anomalies – both the cool anomalies and the heat wave in the Tasman – but the overall pattern remains similar.

What about rainfall?

The seasonal outlook is suggesting less rain over the Coral Sea and less rain in QLD. Conceptually, we could theorise that if the southeasterly trade winds blow over cooler water they are less likely to develop deep convection, and then less likely to bring convective rain onshore to the coast.
An area of less chance of rain also appears in the Southern Ocean to the south of WA. This is another area of negative SST anomaly, but not a region we associate with tropical convection. Behind a cold front small cell convection can cause showers, but would a degree or two of SST make much difference to overall rainfall in this scenario? What may be happening here? Please leave a comment if you have ideas.
Upwelling relief – NSW warms up
The beaches of NSW have had a burst of warm water with the MHL Sydney buoy now reading 26 deg C. This has led to the unlikely scenario of SSTs being theoretically high enough to support TCs off Sydney, but not off Townsville! See TCHP plots here.

For most of the summer, high pressure in the Tasman Sea has caused extended periods of northeasterly winds and persistent upwelling in central NSW. Chilly beach temperatures hit the news for much of January and early Feb.
A clear indicator of this upwelling is the SST reading of the Crowdy Head buoy – the dark green line in the plot below.
Now this buoy has recovered from periods of 15 deg C to be measuring a balmy 24 deg C.

What’s going on?
Firstly, the northeasterly winds have eased which has relaxed the upwelling of deeper water. Secondly, there is a large warm eddy that has moved ashore.

But almost as soon as NSW beaches can celebrate the arrival of tropical waters … the cooler temperatures might be coming back!
Compare the Day 1 and Day 7 OceanMAPS forecasts below.

Northeasterly winds return on Wednesday which will bring a recurrence of upwelling along the coast.

Another culprit is a strong cold eddy that will propagate further westward. Not west enough to bring the cold-core water directly to the shore, but west enough to draw the main arm of the EAC down the eastern side of the eddy and away from the coast.

It looks like beachgoers in NSW will continue to have plenty of temperature variability in weeks to come.