
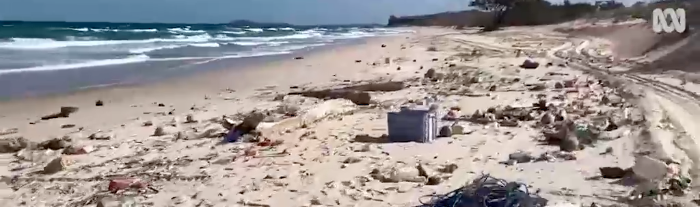
- Rubbish-strewn Arnhem land blames ocean currents
- Eddy generation in the west
- Cold anomalies in the tropics – are they real?
SST
Anomalies are fairly neutral around the country with the exception of cold inshore waters in the tropics, and two hot spots: south west corner near Cape Leeuwin, and the southeast corner of Tasmania.

The cold water inshore in the tropics has been developing since mid-May. This is a standard winter feature but both RAMSSA and SSTAARS are showing it as anomalously cold. The water may indeed be colder than usual due to persistent clear skies in the region causing good radiative cooling in the shallow areas close to shore. However, another factor is that the underlying climatologies may not capture the true seasonal signal if satellite estimates mistake the inshore water for clouds (ie. the satellite temperatures are so cold, they look like cloud tops). This is suggested in the latest SSTAARS images from OceanCurrent. In the far south of the Gulf, the waters are below 22 deg C, but the furthest inshore points are masked.

The anomaly field is shown below.

RAMSSA shows a stronger negative anomaly, with temperatures up to 3 degrees below normal. The RAMSSA climatology is a weighted combination of the previous week’s Weekly Global SST analysis (1 degree) and previous day’s RAMSSA SST analysis (1/12 degree). If the climatology uses satellite estimates that mistake cool water for clouds, and is then further smoothed by blending with a global product, then it is unlikely to represent true seasonal values at the coasts, and we may see this ‘anomaly’ persist for a while yet.

Currents
Residents and researchers in Arnhem Land are shocked by the amount of rubbish washing ashore on remote beaches. The waste is of Indonesian origin and is suspected to be transported into the Gulf of Carpentaria during the wet season when there are predominant northwesterly winds. Now, in the dry season the southeasterly trades are pushing the rubbish back onto the shores of the western Gulf. The ABC website quotes Dr Frederieke Kroon who describes the currents in the Gulf as circular.

OceanMAPS forecasts do show a northwestward surface current of 0.2 to 0.4 knots along the southern shore line of the Gulf.

Atmospheric models indicate that the winds have recently tended southerly in the evenings, and east-southeasterly in the mornings. Ekman transport from this forcing would drive surface water west to southwest.

The situation may also be driven by density differences. The inshore water is cooler but it is also less saline.


Wave forcing from Stokes Drift is another potential contributor, with general westward movement.

Note that tidal forcing is not included in the OceanMAPS model. Spring tides occurred last week between 16th and 19th of June, with high water marks up to 2.05 m, which would have brought more debris onshore than otherwise.
What do you think? What is the rubbish at Cape Arnhem driven by? Comments invited below.
The marine debris problem in Arnhem Land is in sharp contrast to the northwest of the country. An article earlier in the week described levels of rubbish at the Ningaloo Reef as ‘incredibly low’. Is this due to environmentally conscious residents, or is it luck of the draw in regards to ocean currents?

Sea level
The Leeuwin Current has spawned some new eddies in the last couple of weeks. The current is typically strongest in May and June, and we can see that new warm core eddies have separated from the coast and are well-defined with closed circulations. The release of the eddies from the coast appears to coincide with coastally-trapped wave events.

The latest sea level analysis shows a large warm-core eddy off Geraldton. It is 120 nm or 220 km across which is particularly big for this region. The sea level anomaly is around 0.5 m and it has geostrophic currents of about 1.5 knots. The eddies tend to propagate WNW over time.

A vertical temperature profile through some of these eddies reveals warm water anomalies at 100 to 200 m depth from recent influx of the Leeuwin Current. The eddies also show anomalies at 450 m depth (northern-most eddy) or 700 m depth (southern eddies) that are indicative of an older structure or deeper water mass.

Slices through the temperature field at 485 and 776 m depth show another view of these eddies compared to their surroundings.


The Leeuwin Current region is very active at the moment and there are large uncertainties in the model about how these features will develop over the next week. The image below show three different model runs for the 26th of June. The most recent run (on the right) develops well-defined cold core eddies in between the warm water. The first run (on the left) has much weaker features. Stay tuned about how these features evolve in the web viewer.